Taking the K9s out for a walk
A hands-on walkthrough of K9s, the terminal UI for managing Kubernetes clusters — installation, navigating resources, viewing logs, pulses, xrays and benchmarking.
Melroy Quailey
Senior engineer, TechSpike
With Kubernetes now established as the de-facto container orchestration system, it’s important that DevOps engineers have the right set of tools to manage and administer their production workloads. These tools let engineers deploy containerised applications and manage the resources of a cluster. They also give an overview of applications running in a cluster, as well as mechanisms for creating or modifying Kubernetes resources (such as Deployments, Jobs, DaemonSets, etc.). They’re essential for the ongoing management, monitoring and maintenance of a cluster, and an essential part of a DevOps engineer’s toolkit.
One such tool that I’ve recently been using is a terminal-based UI called K9s (cool name). K9s is an open-source tool developed by Derailed which enables engineers to manage their cluster directly from the terminal. If you’re a terminal jockey like me, then K9s may be a great addition to your toolset — leveraging the power of the terminal with a convenient UI to quickly visualise and manage all aspects of a running cluster.
In the following guide I’ll show you how to get up and running with K9s and walk through the various features this exciting tool has to offer.
Installation
K9s is available on macOS, Linux and Windows, and can be installed using the following methods.
1. From binary
Binaries for each of these operating systems can be downloaded from the K9s releases page.
The binary is downloaded as a tarball. Once it has been downloaded, un-compress it and optionally add it to your PATH:
tar -xvf k9s_Darwin_x86_64.tar.gz
sudo mv k9s /opt/local/bin/k9s
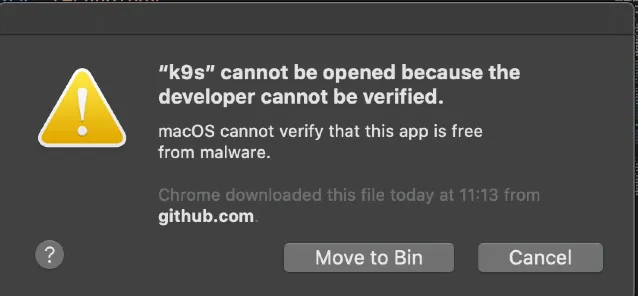
# macOS Catalina+ users only: due to the security enhancements that Apple
# introduced from Catalina, you may get the message
# "Cannot be opened because the developer cannot be verified".
#
# This is because the executable has been downloaded from the internet
# and has not been signed by Apple.
#
# You can remove the Apple quarantine by executing the following command.
# (Be sure you have downloaded from the official k9s repository
# https://github.com/derailed/k9s/releases and validated it via the checksum!)
xattr -d com.apple.quarantine k9s2. Via package manager
K9s can be installed via various package managers specific to your OS. For a detailed list, visit the K9s installation guide.
3. Build and install from source
K9s can be built and installed from source. For detailed instructions visit the K9s installation guide.
Up and running
Once installed, K9s can be launched from the terminal. Before you do this, ensure your terminal is set up to support 256 colours. You can do this by running:
export TERM=xterm-256colorTo launch K9s, just execute the following from the terminal:
k9sK9s should launch, showing you a screen like the one below:
By default, K9s will connect to your current Kubernetes context, defined in your local
kube config file, for example ~/.kube/config.
To override the current context, start K9s with the --context argument:
k9s --context <context>Similarly, K9s will use the namespace specified in the current context by default. To override this, start K9s with:
k9s --context <context> --namespace <namespace>There are many more startup options available, which can be viewed by running k9s --help:
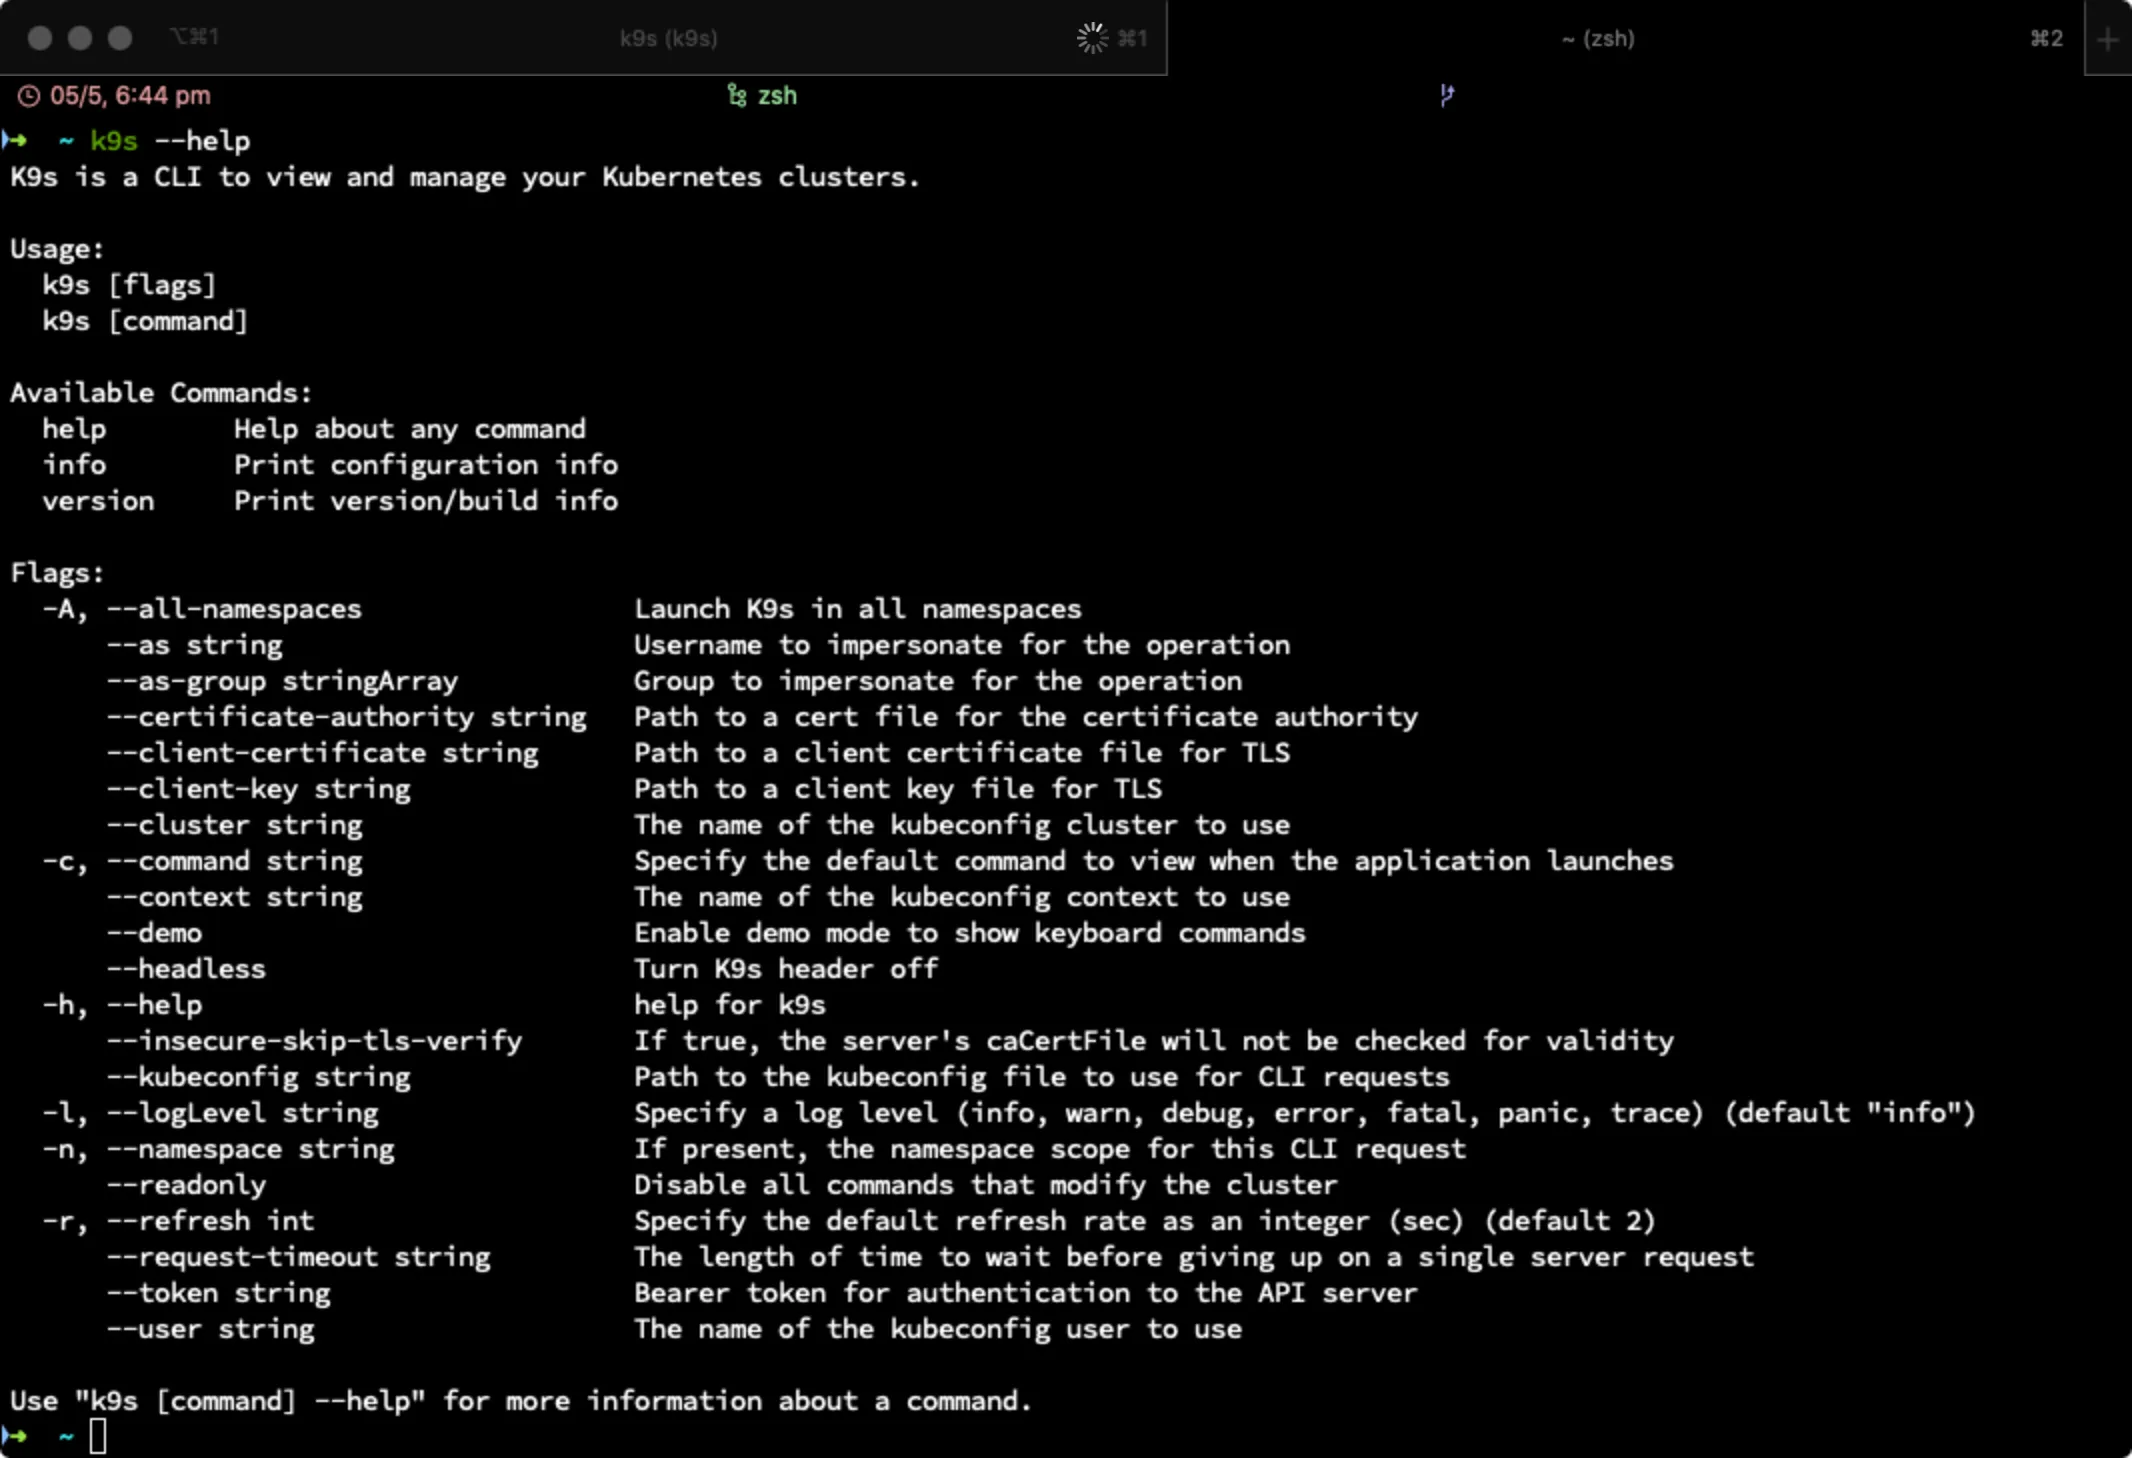
To quit K9s once you’re in the UI, press Ctrl-C.
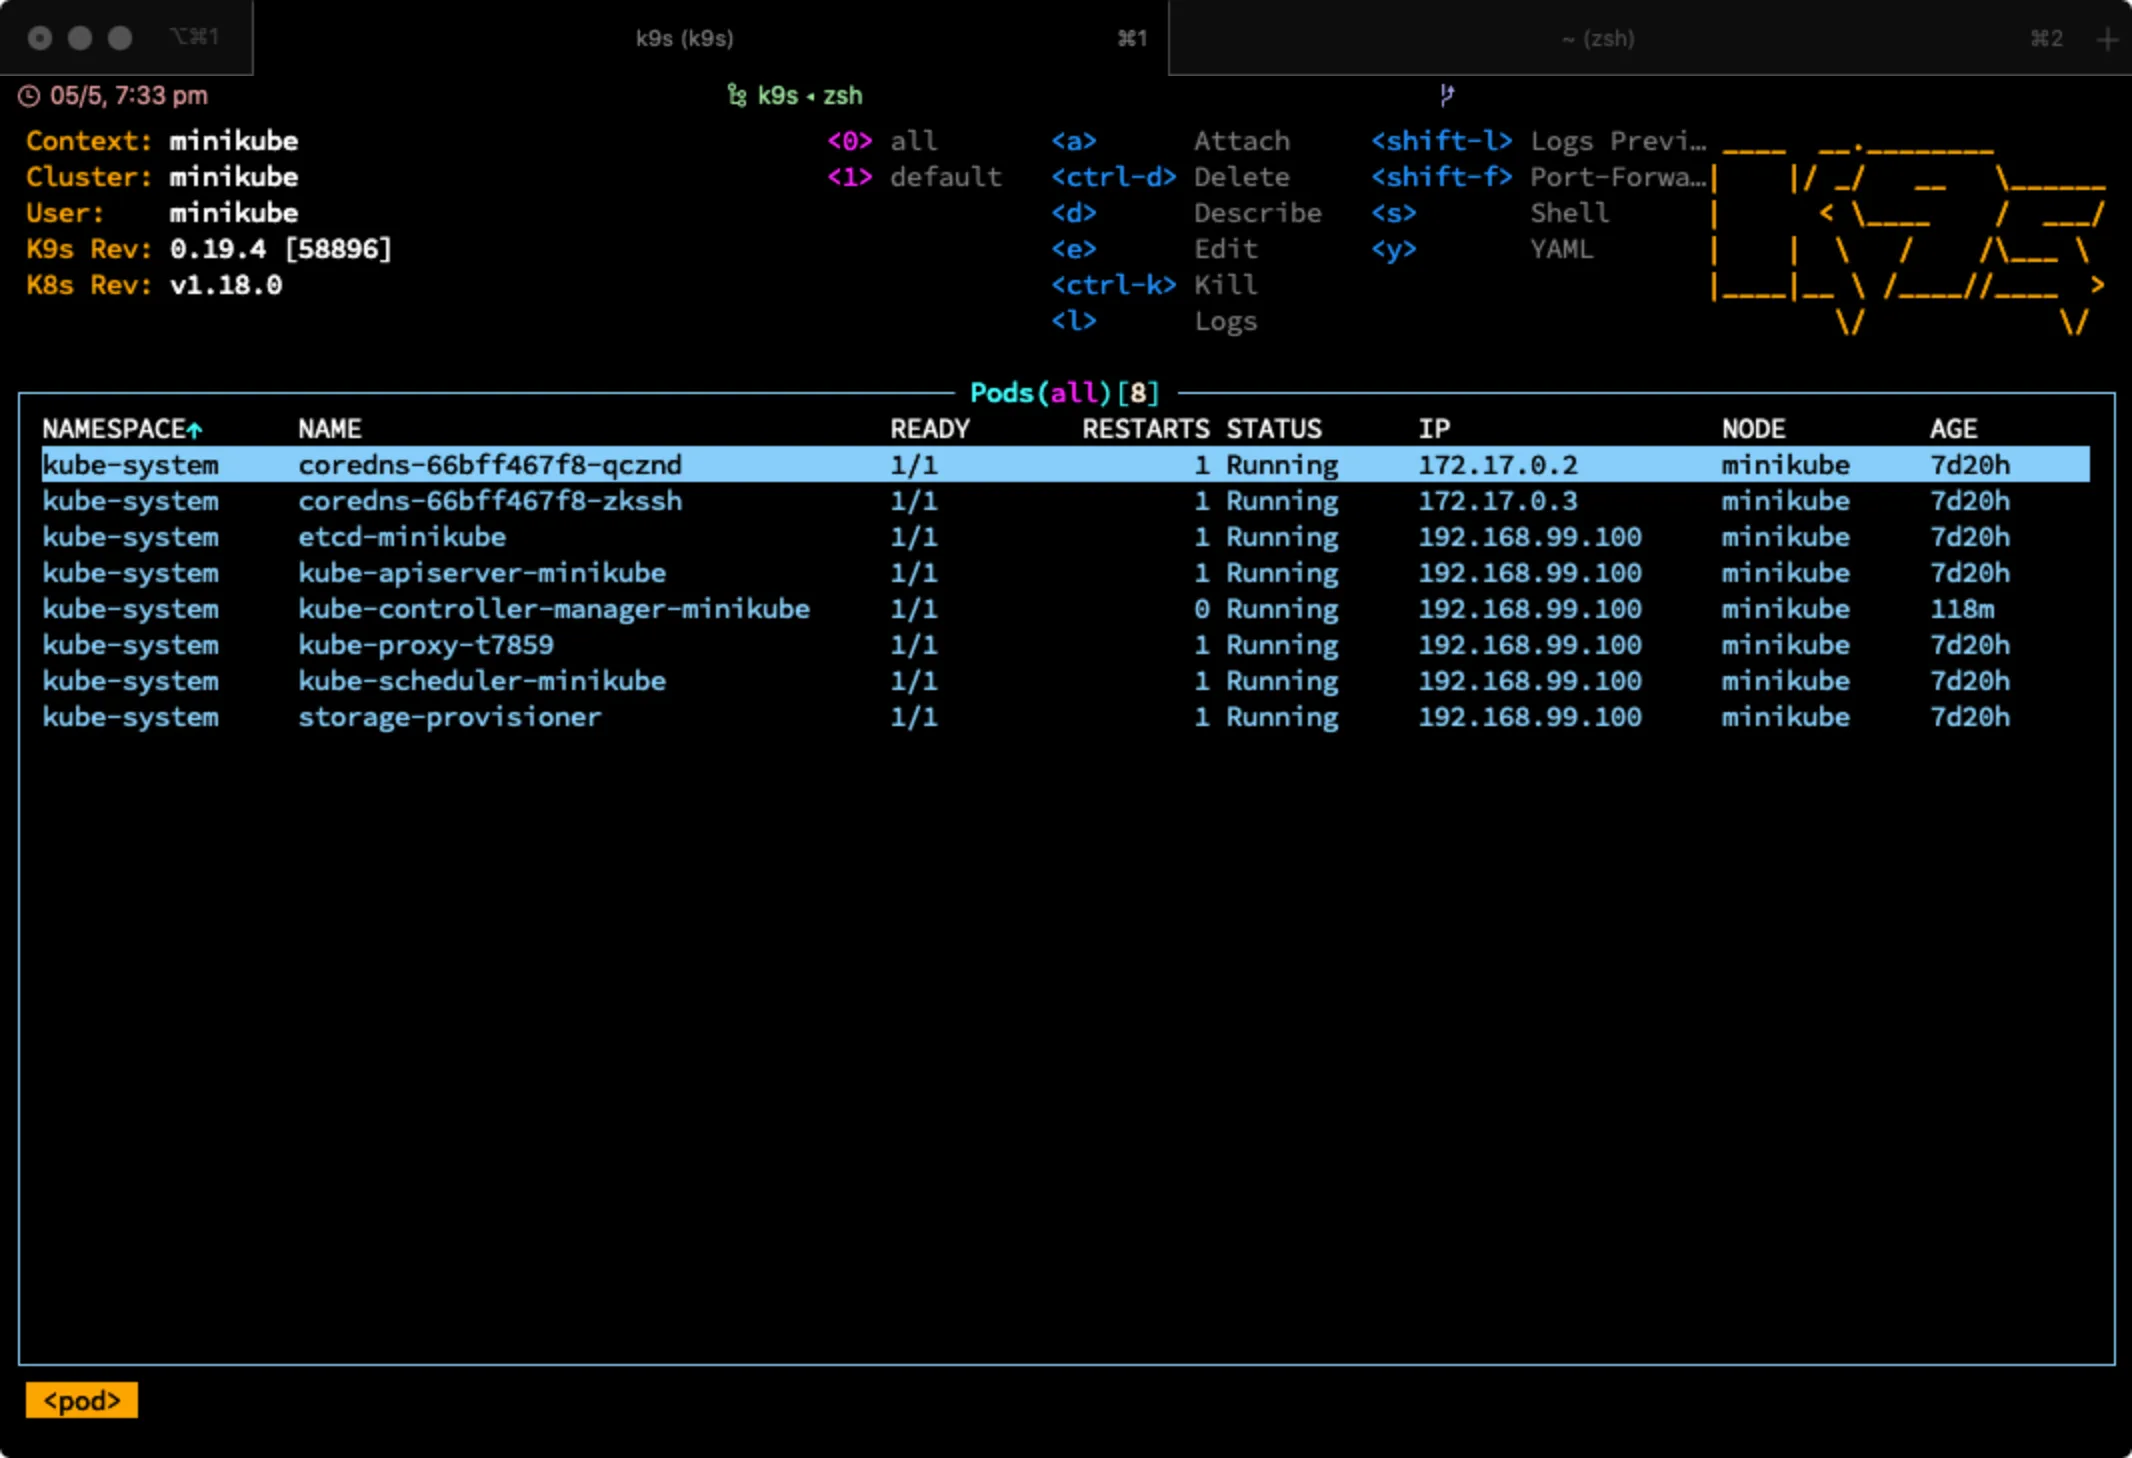
The K9s dashboard
When you start K9s, you’re presented with the main dashboard:
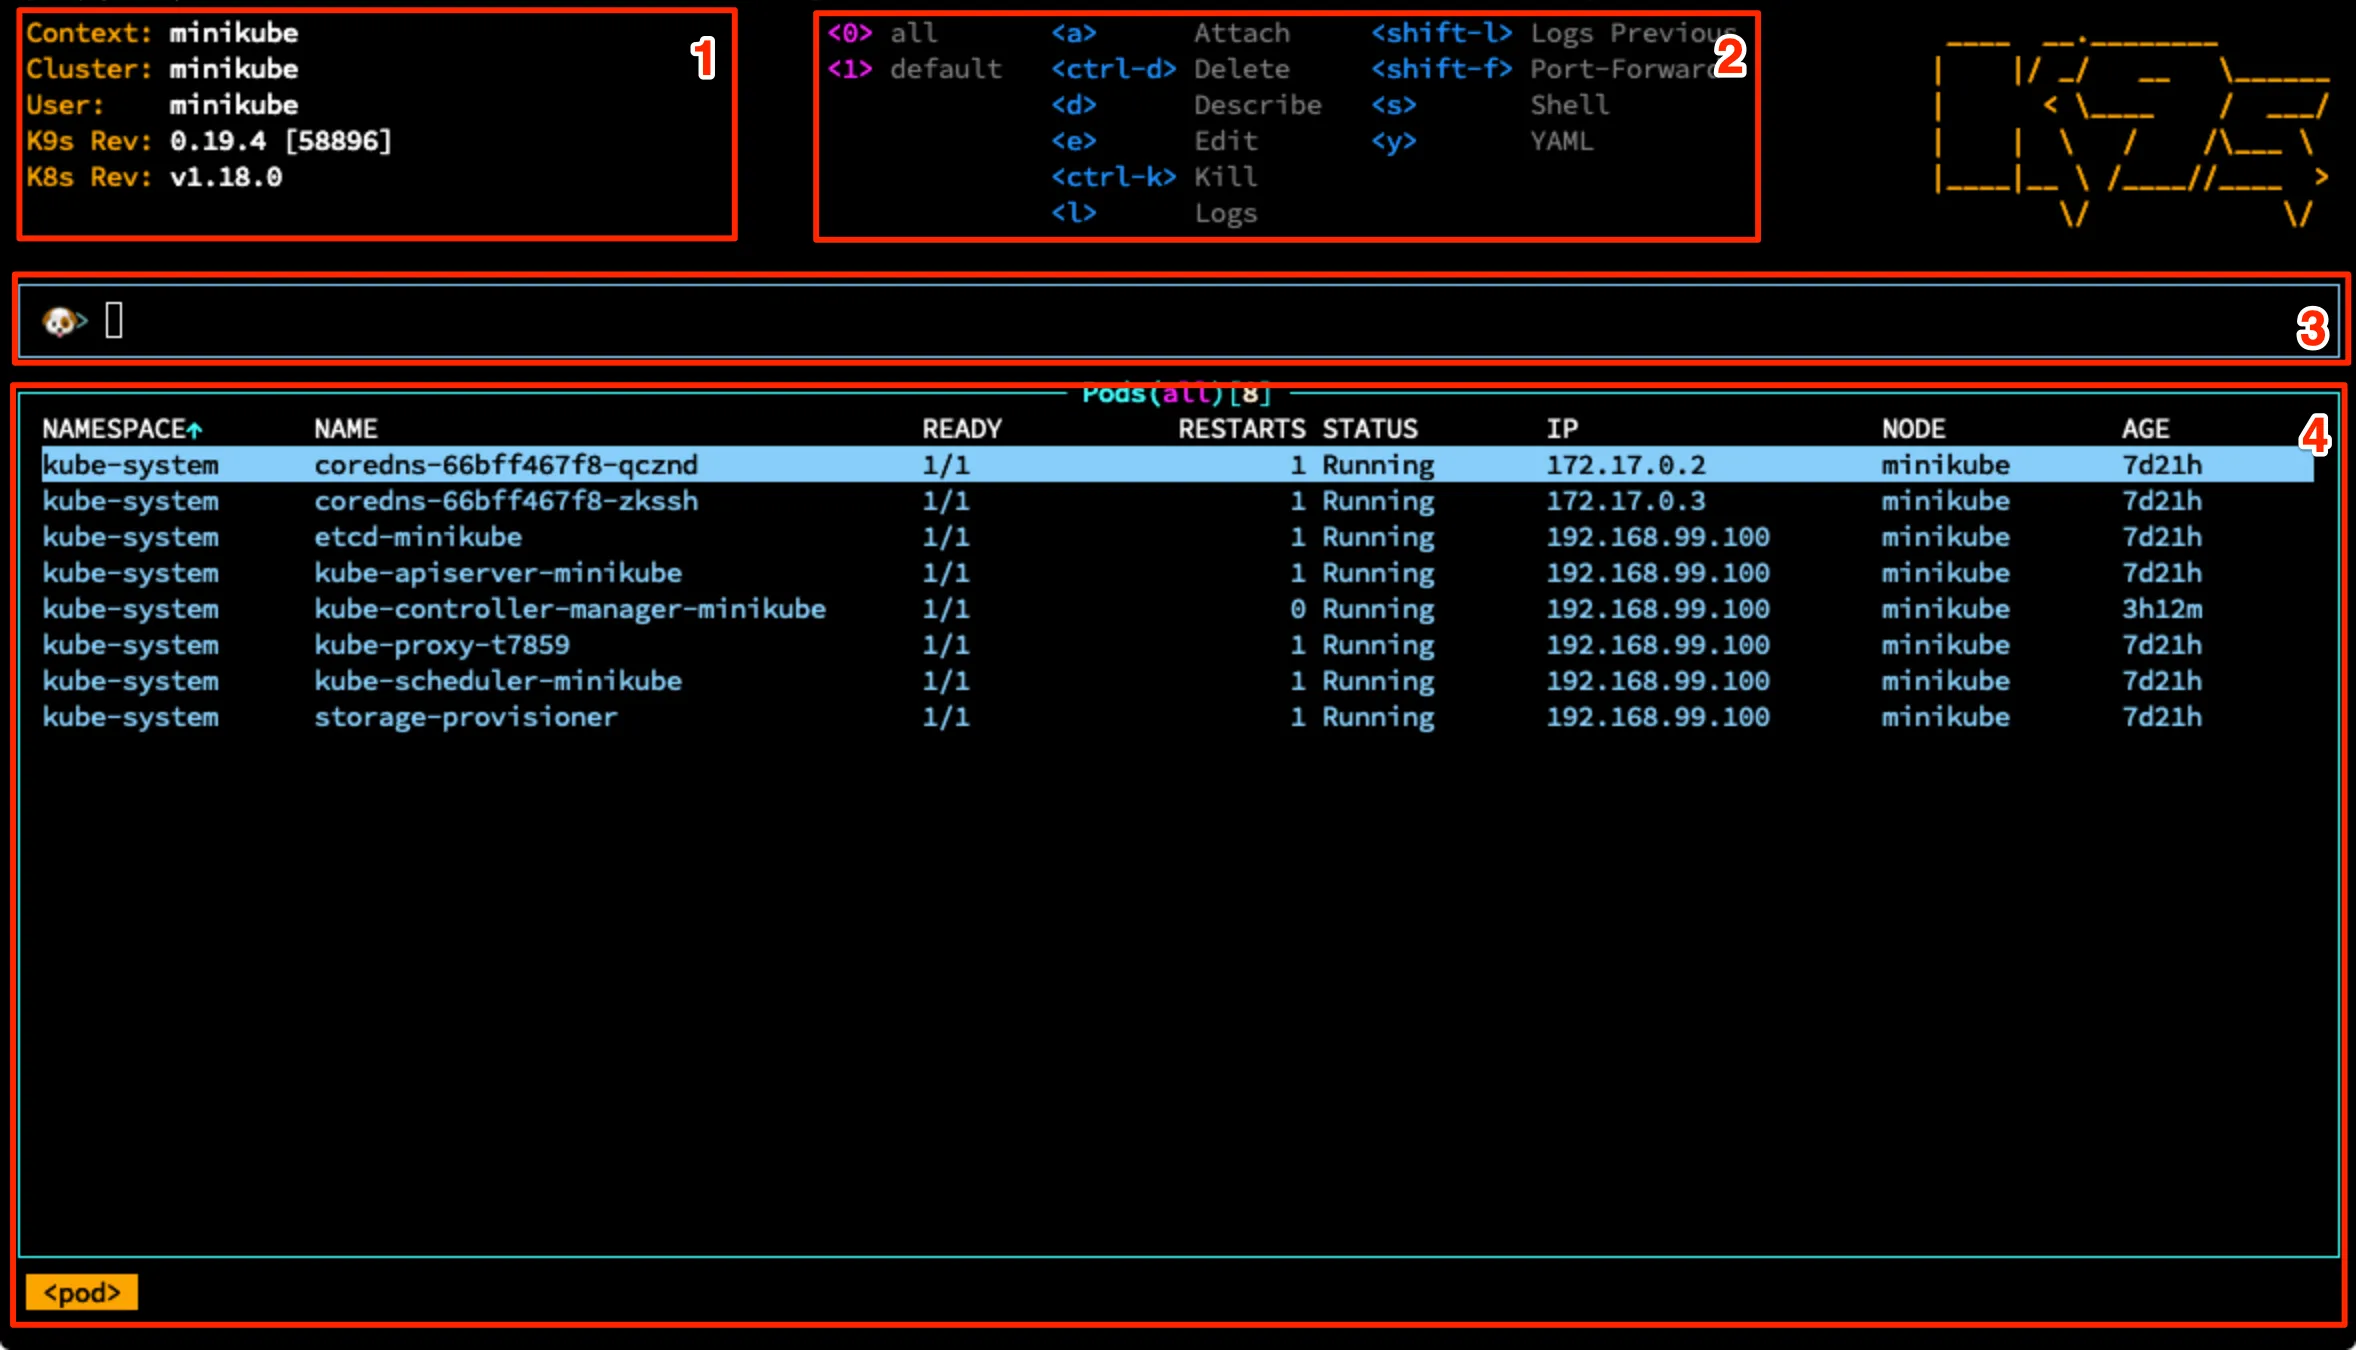
The K9s dashboard is comprised of four main areas:
- Cluster info — shows information about the connected cluster: context, cluster name, connected user, etc.
- Keyboard shortcuts — a handy reference to the main keyboard shortcuts used within K9s.
- K9s command line — provides a command prompt that can be used to directly issue commands to K9s (accessed by hitting Shift + :). More on the available commands later.
- Main info pane — displays the majority of the information about resources running in
your cluster. By default it shows the Pods running in the current namespace. Each
resource can be highlighted with the up and down arrows. The resource type you’re
viewing is highlighted in the bottom-left corner (in the example above,
<pod>).
Viewing resources
From the main dashboard, K9s provides a list of the resources running in your cluster, filtered by namespace. By default, resources of type Pod are displayed; however, K9s conveniently lets you display any built-in Kubernetes resource (deployments, services, pods, ingresses, etc.). You can also view custom resource definitions (CRDs) through the same interface.
To view a specific resource type, press the colon key, start typing the name of the resource type you want to view, and press enter to select it. Examples of this can be seen below:
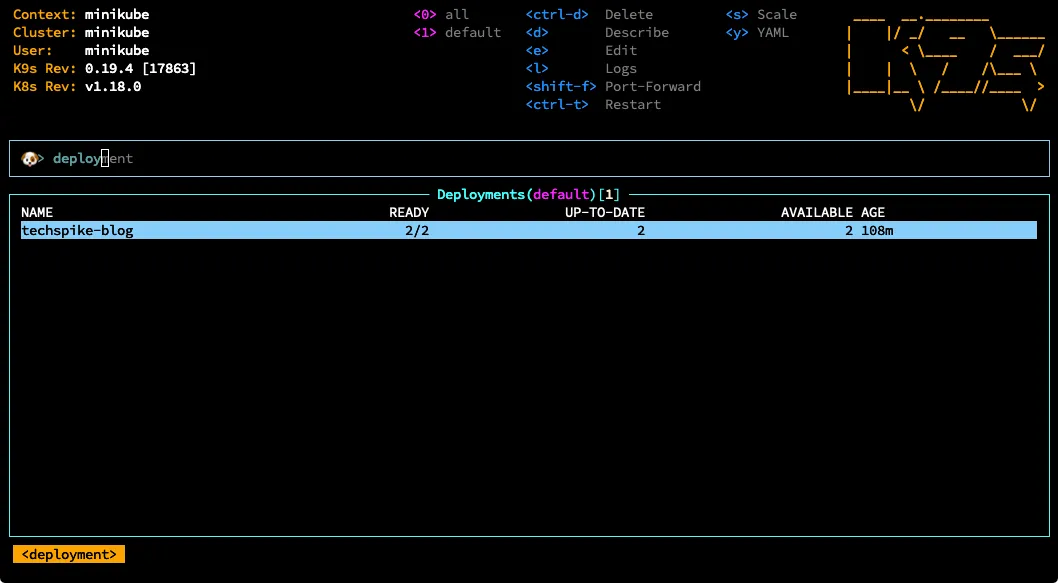
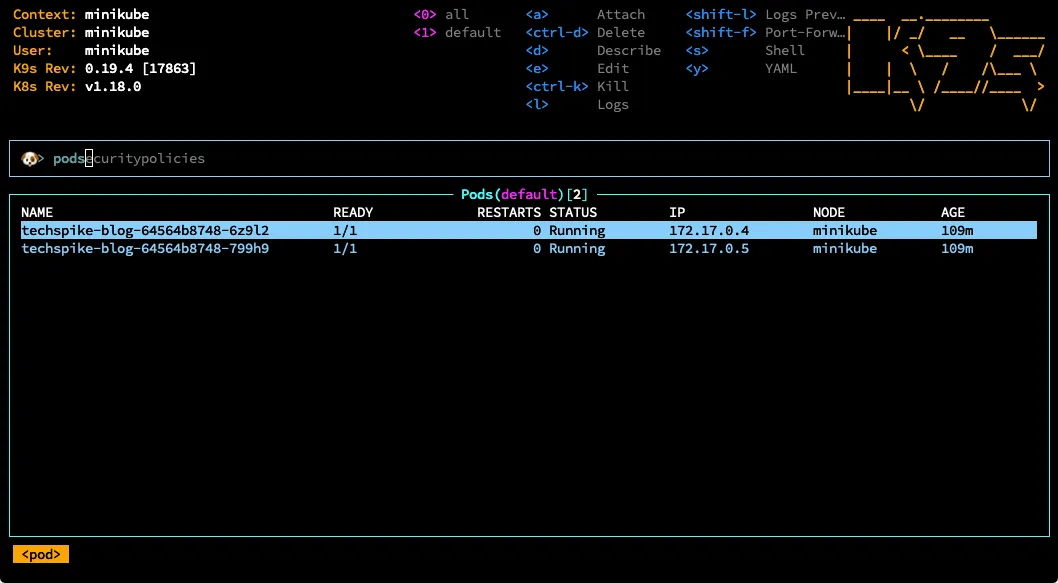
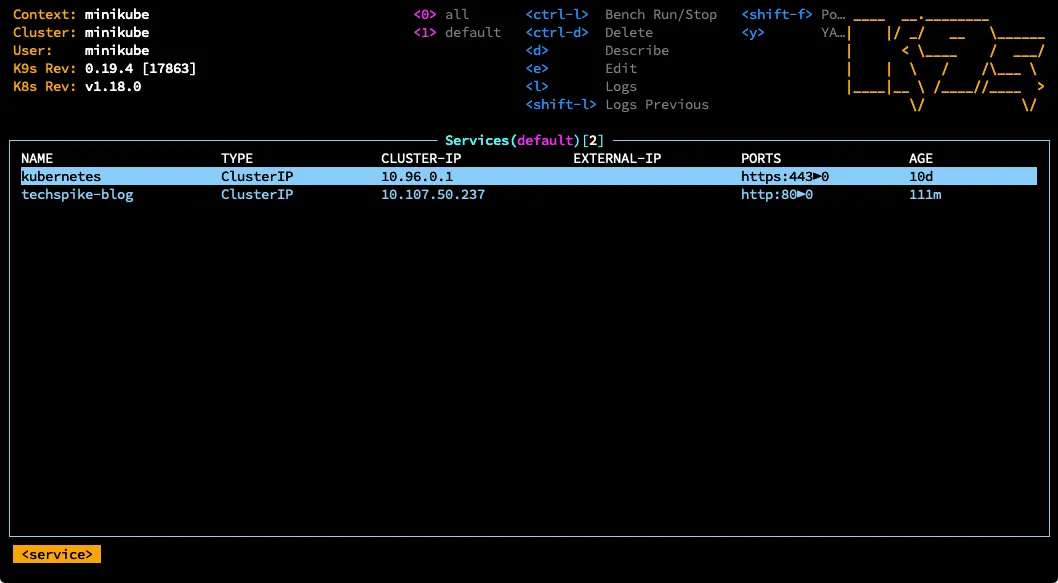
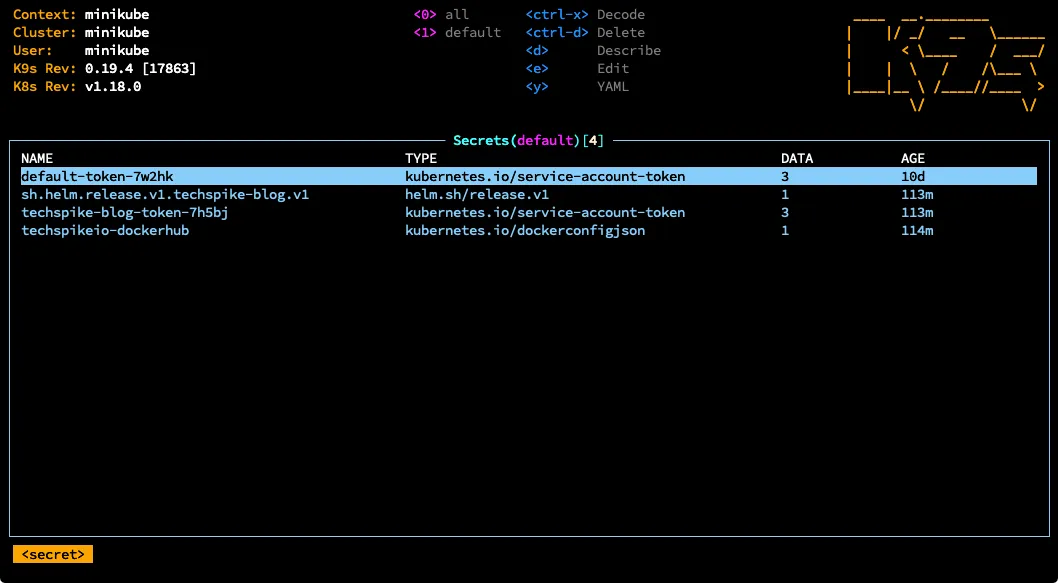
Once you can see the list of resource types you’re interested in, use the up and down arrows to select a resource. Pressing enter on the resource lets you drill down into the resources associated with it — for example you can drill down from deployment → pods → containers → logs.
For the resources displayed, you can see various live statuses. For example, in the Deployments view you can see how many resources are ready, whether they’re up to date, and how many are available. The statuses change depending on the resource type you’re viewing. When viewing pods you can see whether a pod is ready, its status (e.g. running), its internal IP address, the node it’s running on and its age.
If the status of your resources changes, this is instantly updated in the view — for example, if a pod goes down it’s displayed in red to alert you immediately. This is really helpful for getting live, real-time information on the resources running in your cluster.
Interacting with resources
Once you’ve selected a resource using the arrow keys, there are various operations K9s lets you execute against it directly from the tool. The available operations change slightly depending on the resource type you’re viewing; however, K9s always keeps a handy quick reference command guide at the top right of the application.
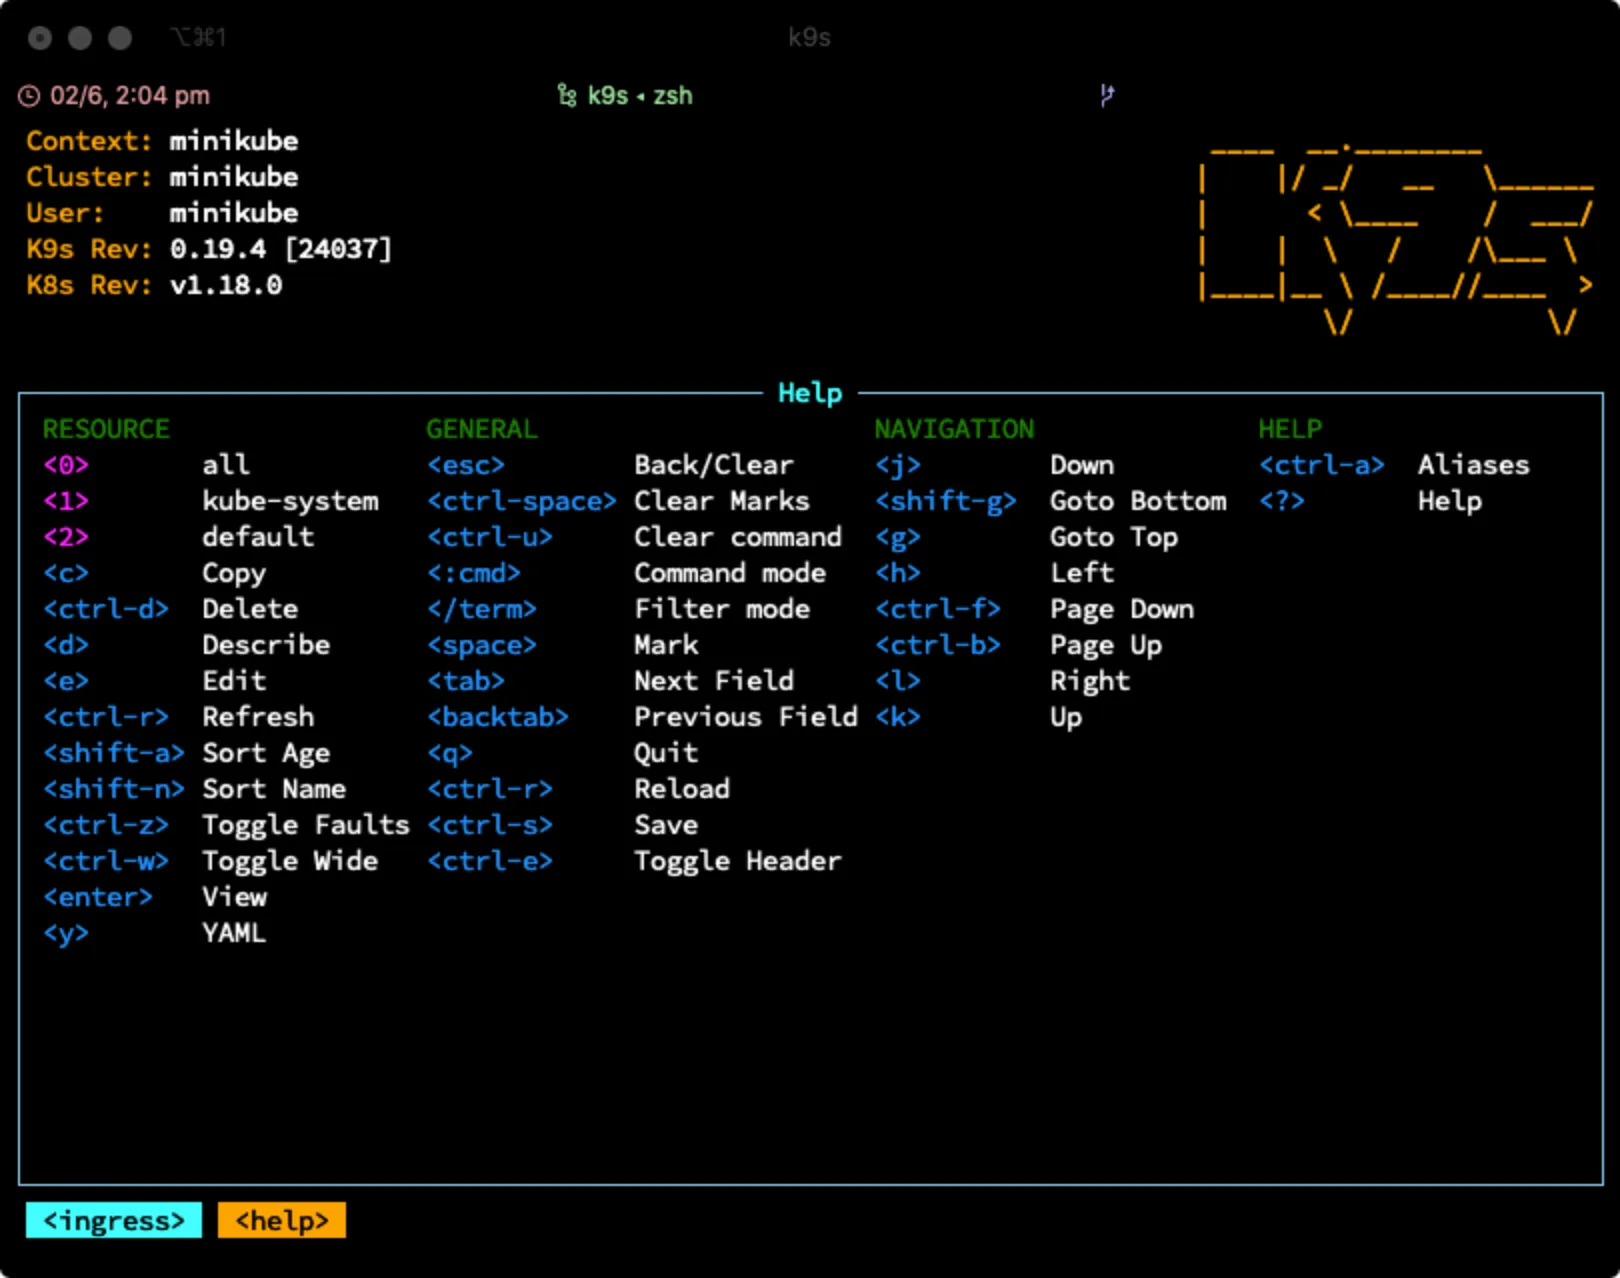
Some of the operations available are as follows:
<d>— describe the resource currently selected<e>— edit the resource in the default editor, such as vi<y>— view the YAML of the resource<s>— open an interactive shell to a running container<a>— attach to the main process within a container<l>— view logs<shift-l>— view previous logs<shift-f>— set up a port-forward to your pod<ctrl-k>— kill the selected resource<ctrl-d>— delete the selected resource<ctrl-a>— list all the resource aliases available, including CRDs. Use the up and down arrows to select and view resources of this type installed in your cluster.?— see a list of all available key bindings.
Viewing logs
K9s provides a convenient way of viewing the logs produced by all of the resources deployed
to your cluster. By simply selecting the resource in the K9s resources area and pressing
l, you can view the logs of individual pods, or pods managed by a controller such as a
deployment, ReplicaSet, DaemonSet, etc.
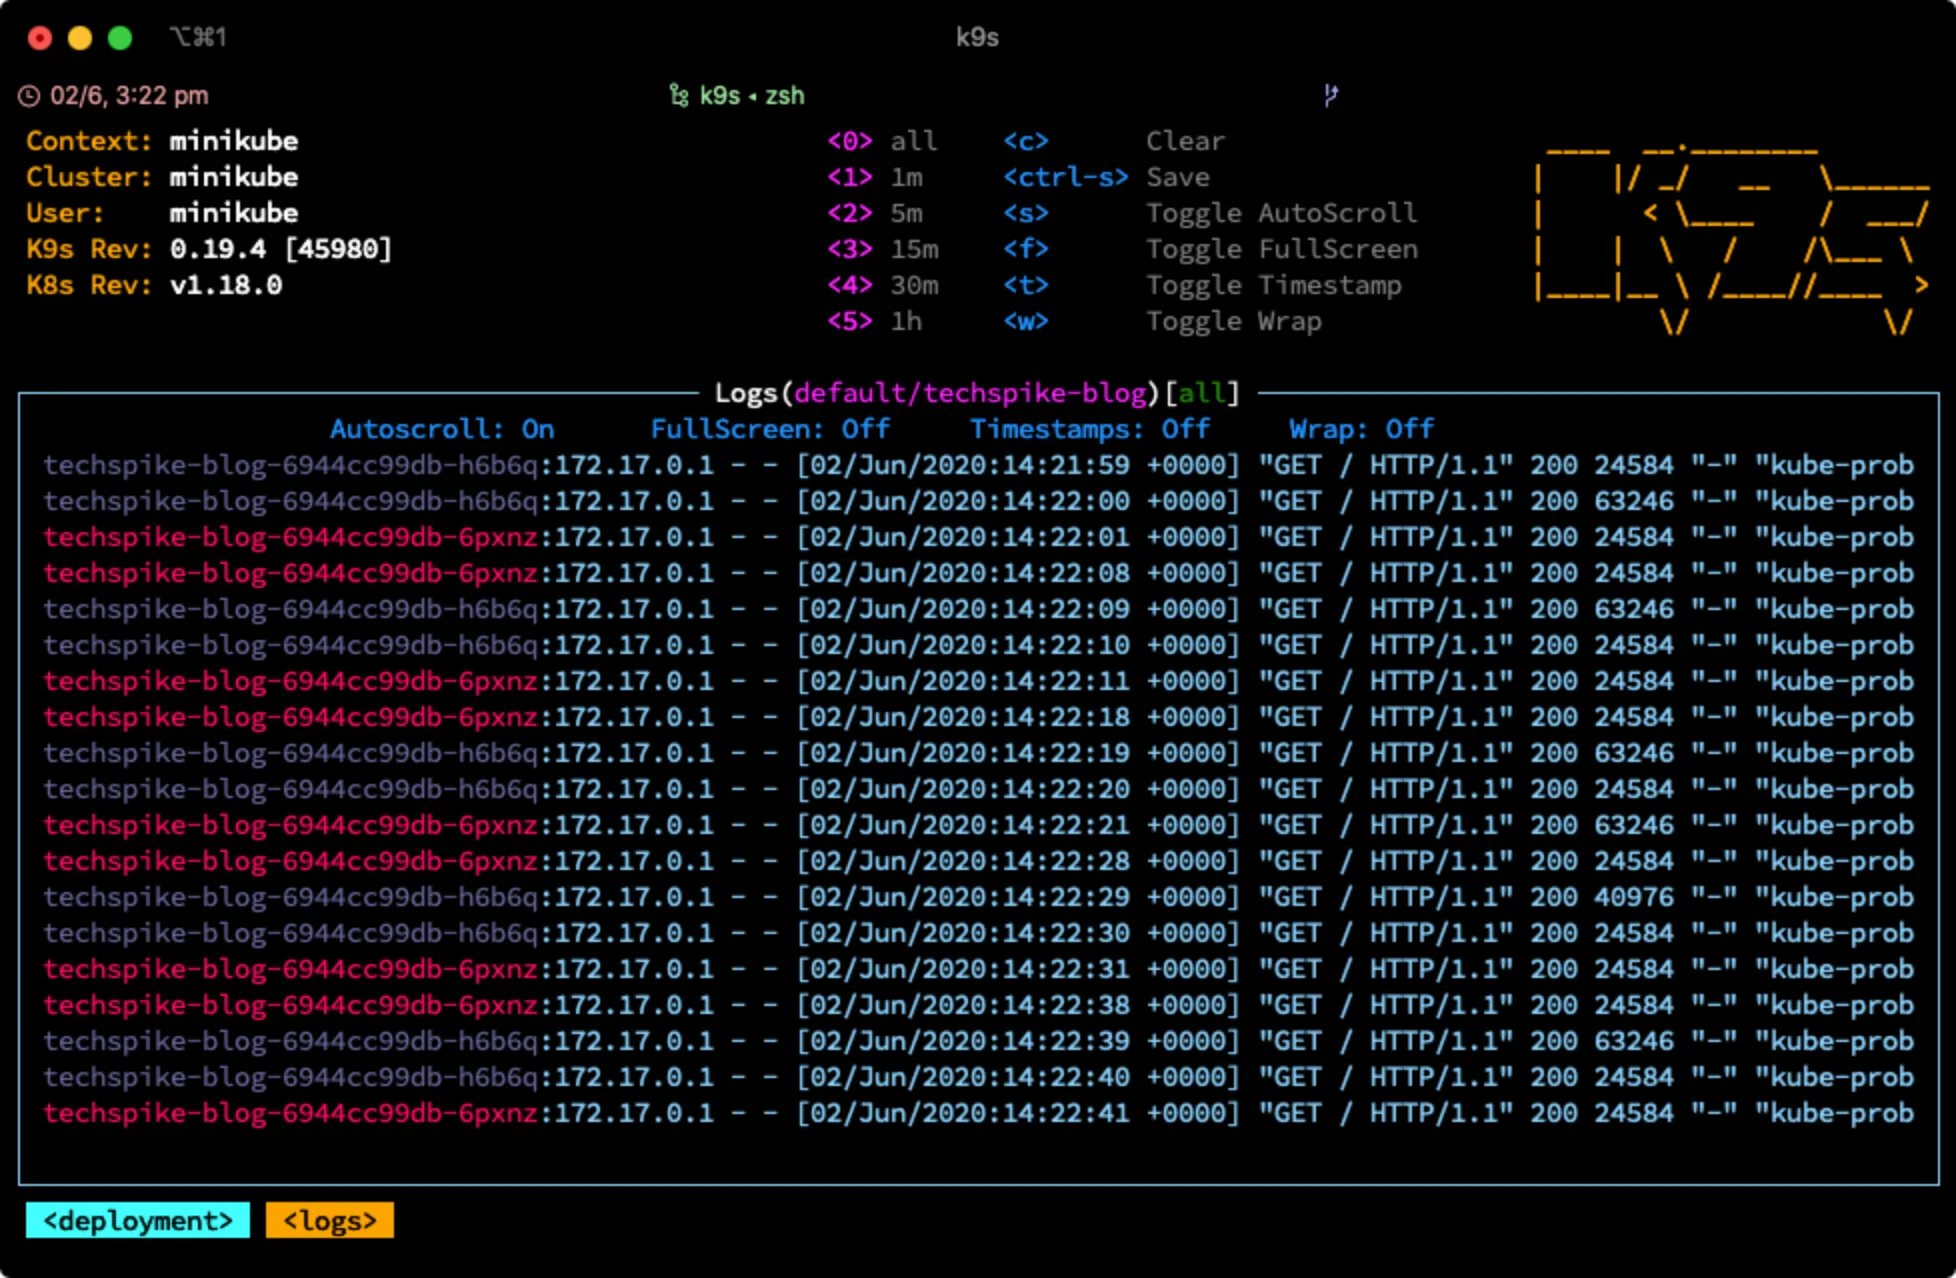
Once viewing the logs, K9s offers a number of commands to manipulate them for your specific needs. Some of these options are:
<0>, <1>, <2>, <3>, <4>, <5>— set the time range for the logs to return: all, 1m, 5m, 15m, 30m and 1h respectively.<c>— clear the logs viewer.<ctrl-s>— save the current logs to your local machine.<s>— toggle logs auto-scroll, off/on.<f>— toggle fullscreen, off/on.<t>— toggle timestamps, off/on.</>— press/and then type a string to search the logs for specific sequences. Pressing enter filters your logs by the search string.
Pulses
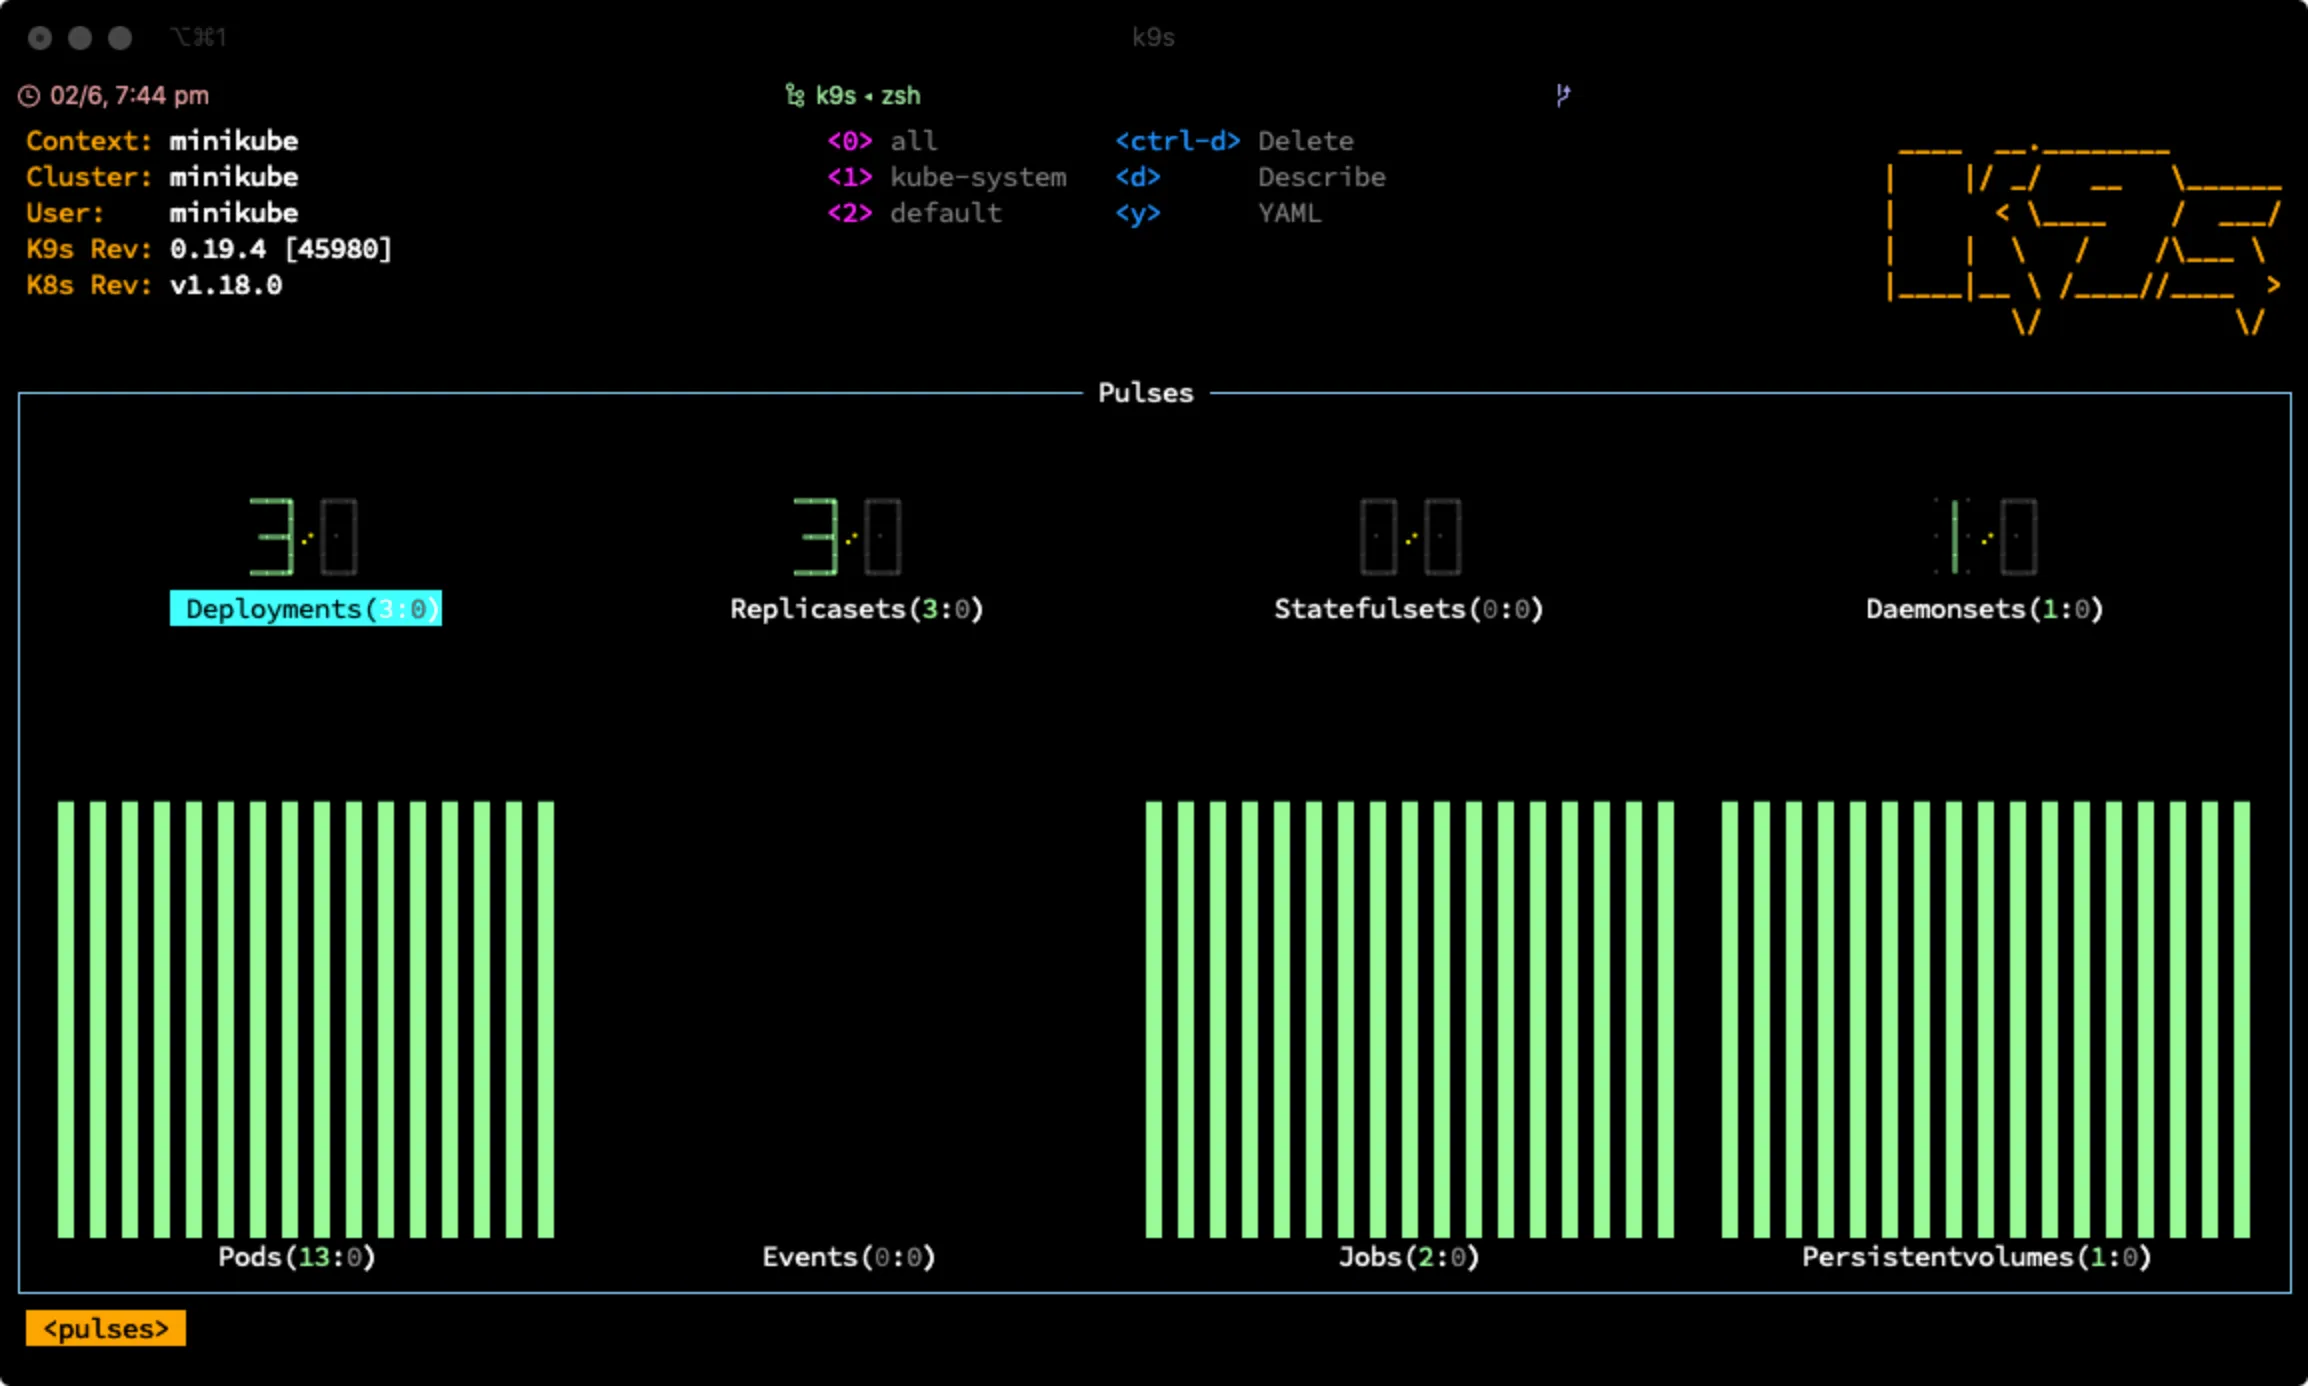
K9s provides a Pulses view which gives you a real-time overview of the status of the resources running in your cluster. For example, you can quickly get an overview of the number of deployments, how many are up and running, or whether any have failed. The same applies to other resource types such as ReplicaSets, StatefulSets, Pods, etc.
Problems are highlighted in red, and by pressing the tab key and enter you can quickly drill down into the resources and inspect any problems.
To access the Pulses view, press : and then enter pulses.
Xrays
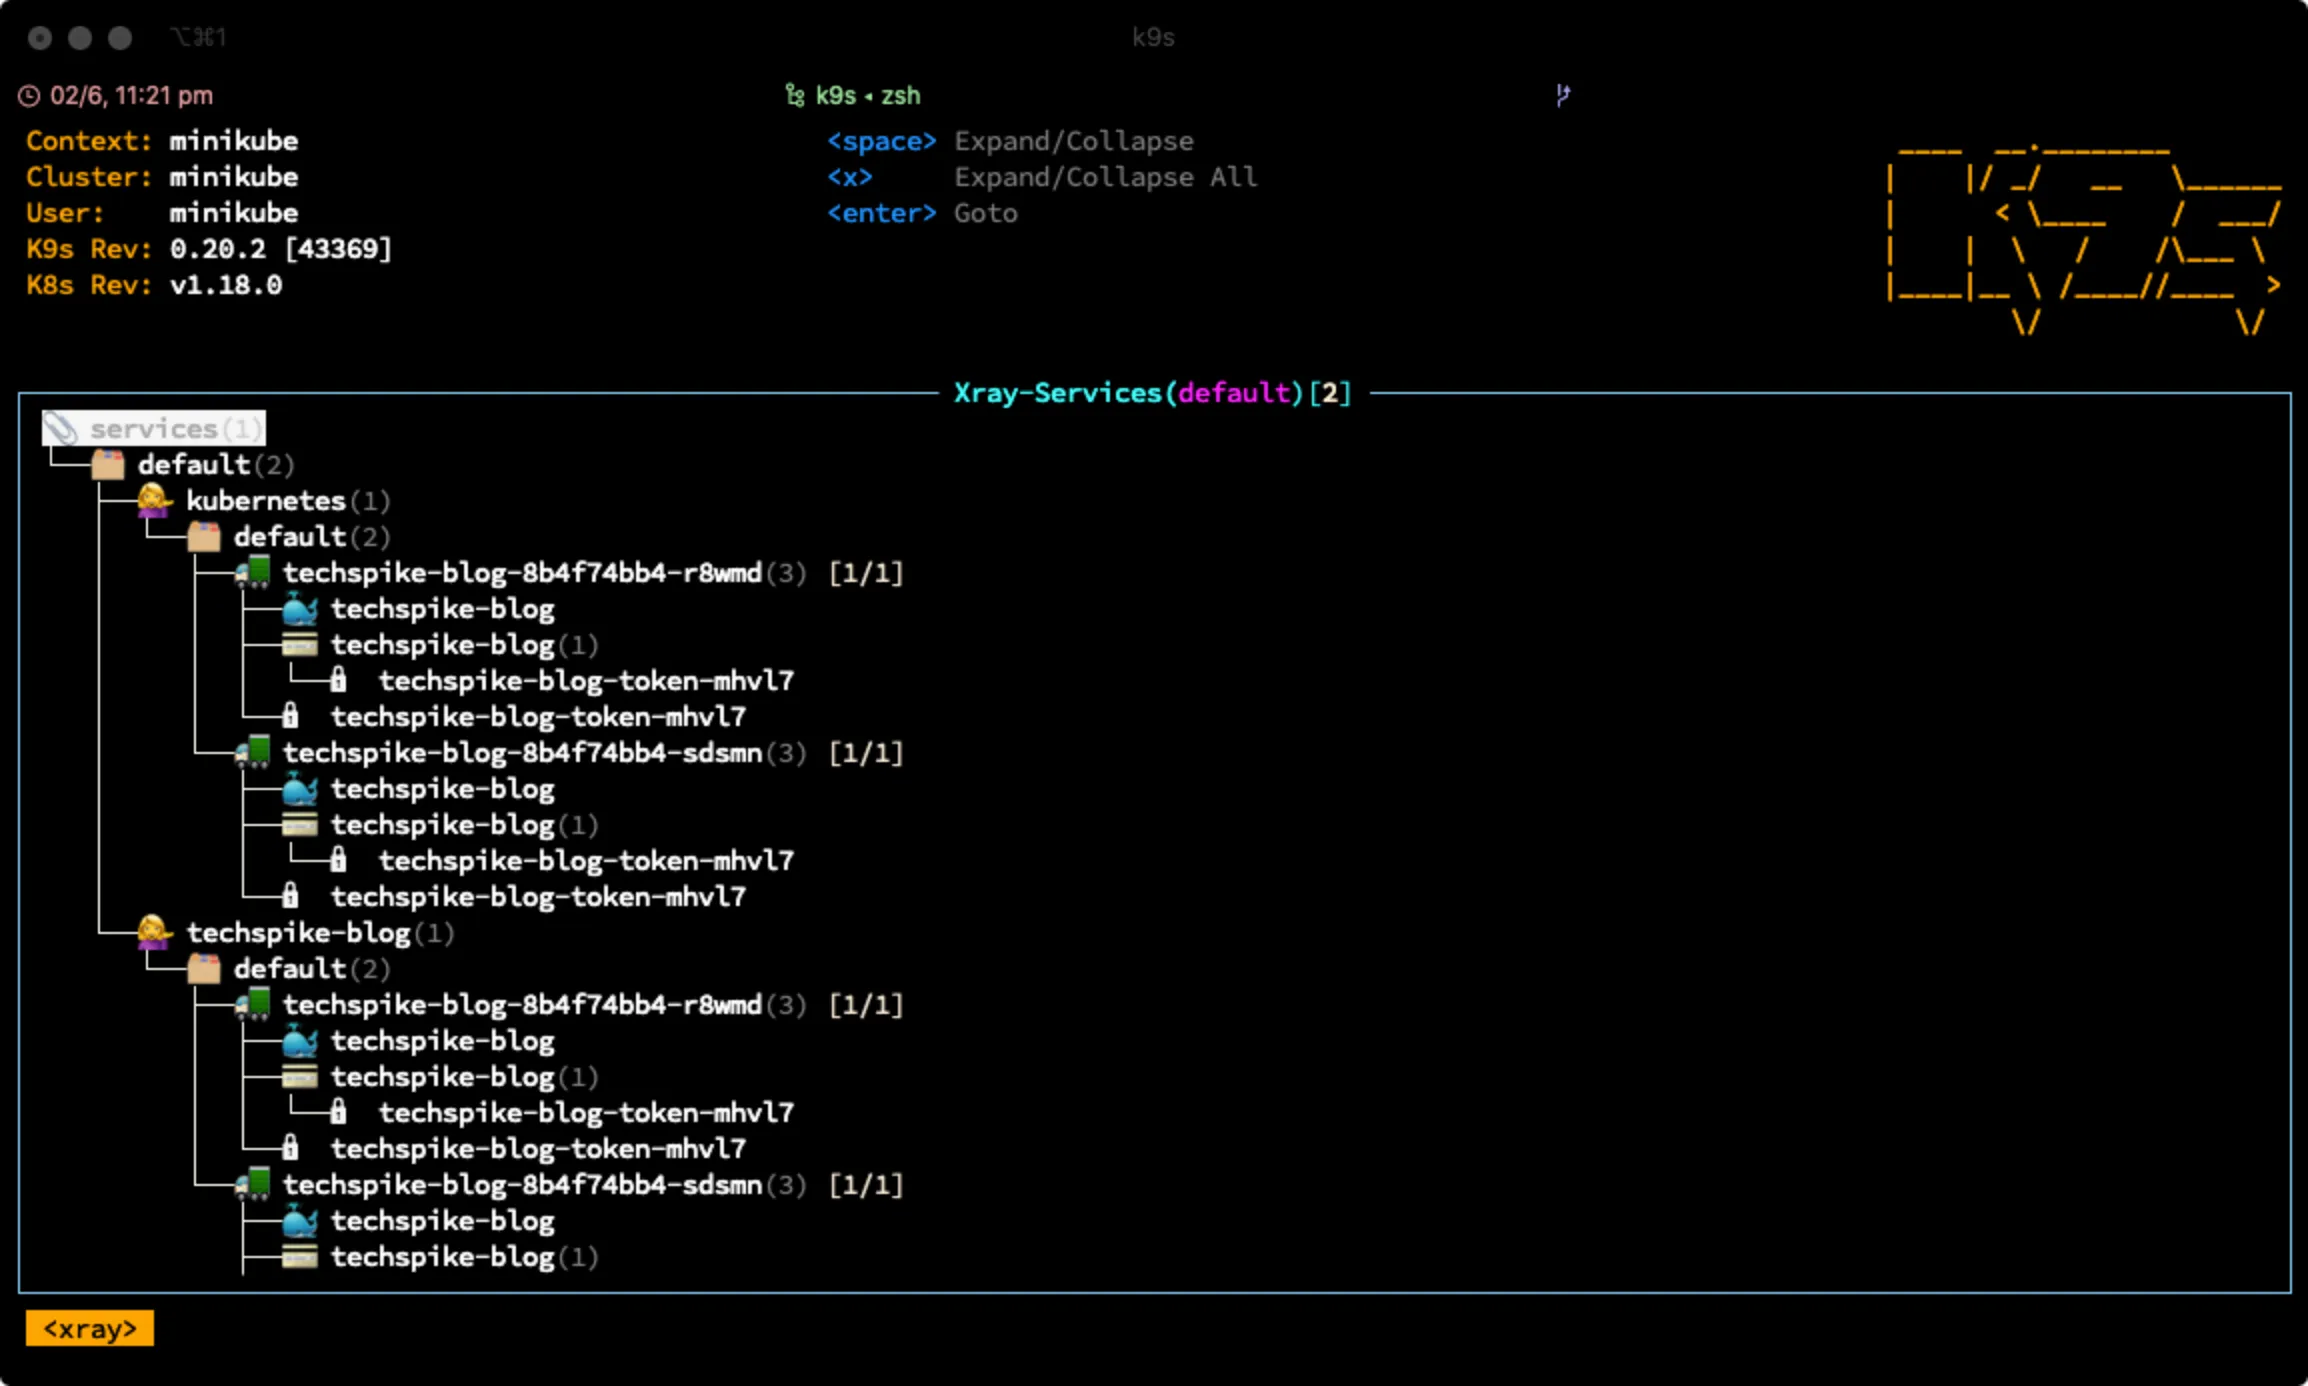
K9s provides an Xray view which gives you an overview of how the resources in your cluster relate to each other. In the Xray view you can see a hierarchy of your resources based on a root resource type, such as Pods, Services, etc. This view is really useful for seeing your resource dependencies.
To access the Xray view, enter the K9s command line by typing :, then type xray Pods
and press enter.
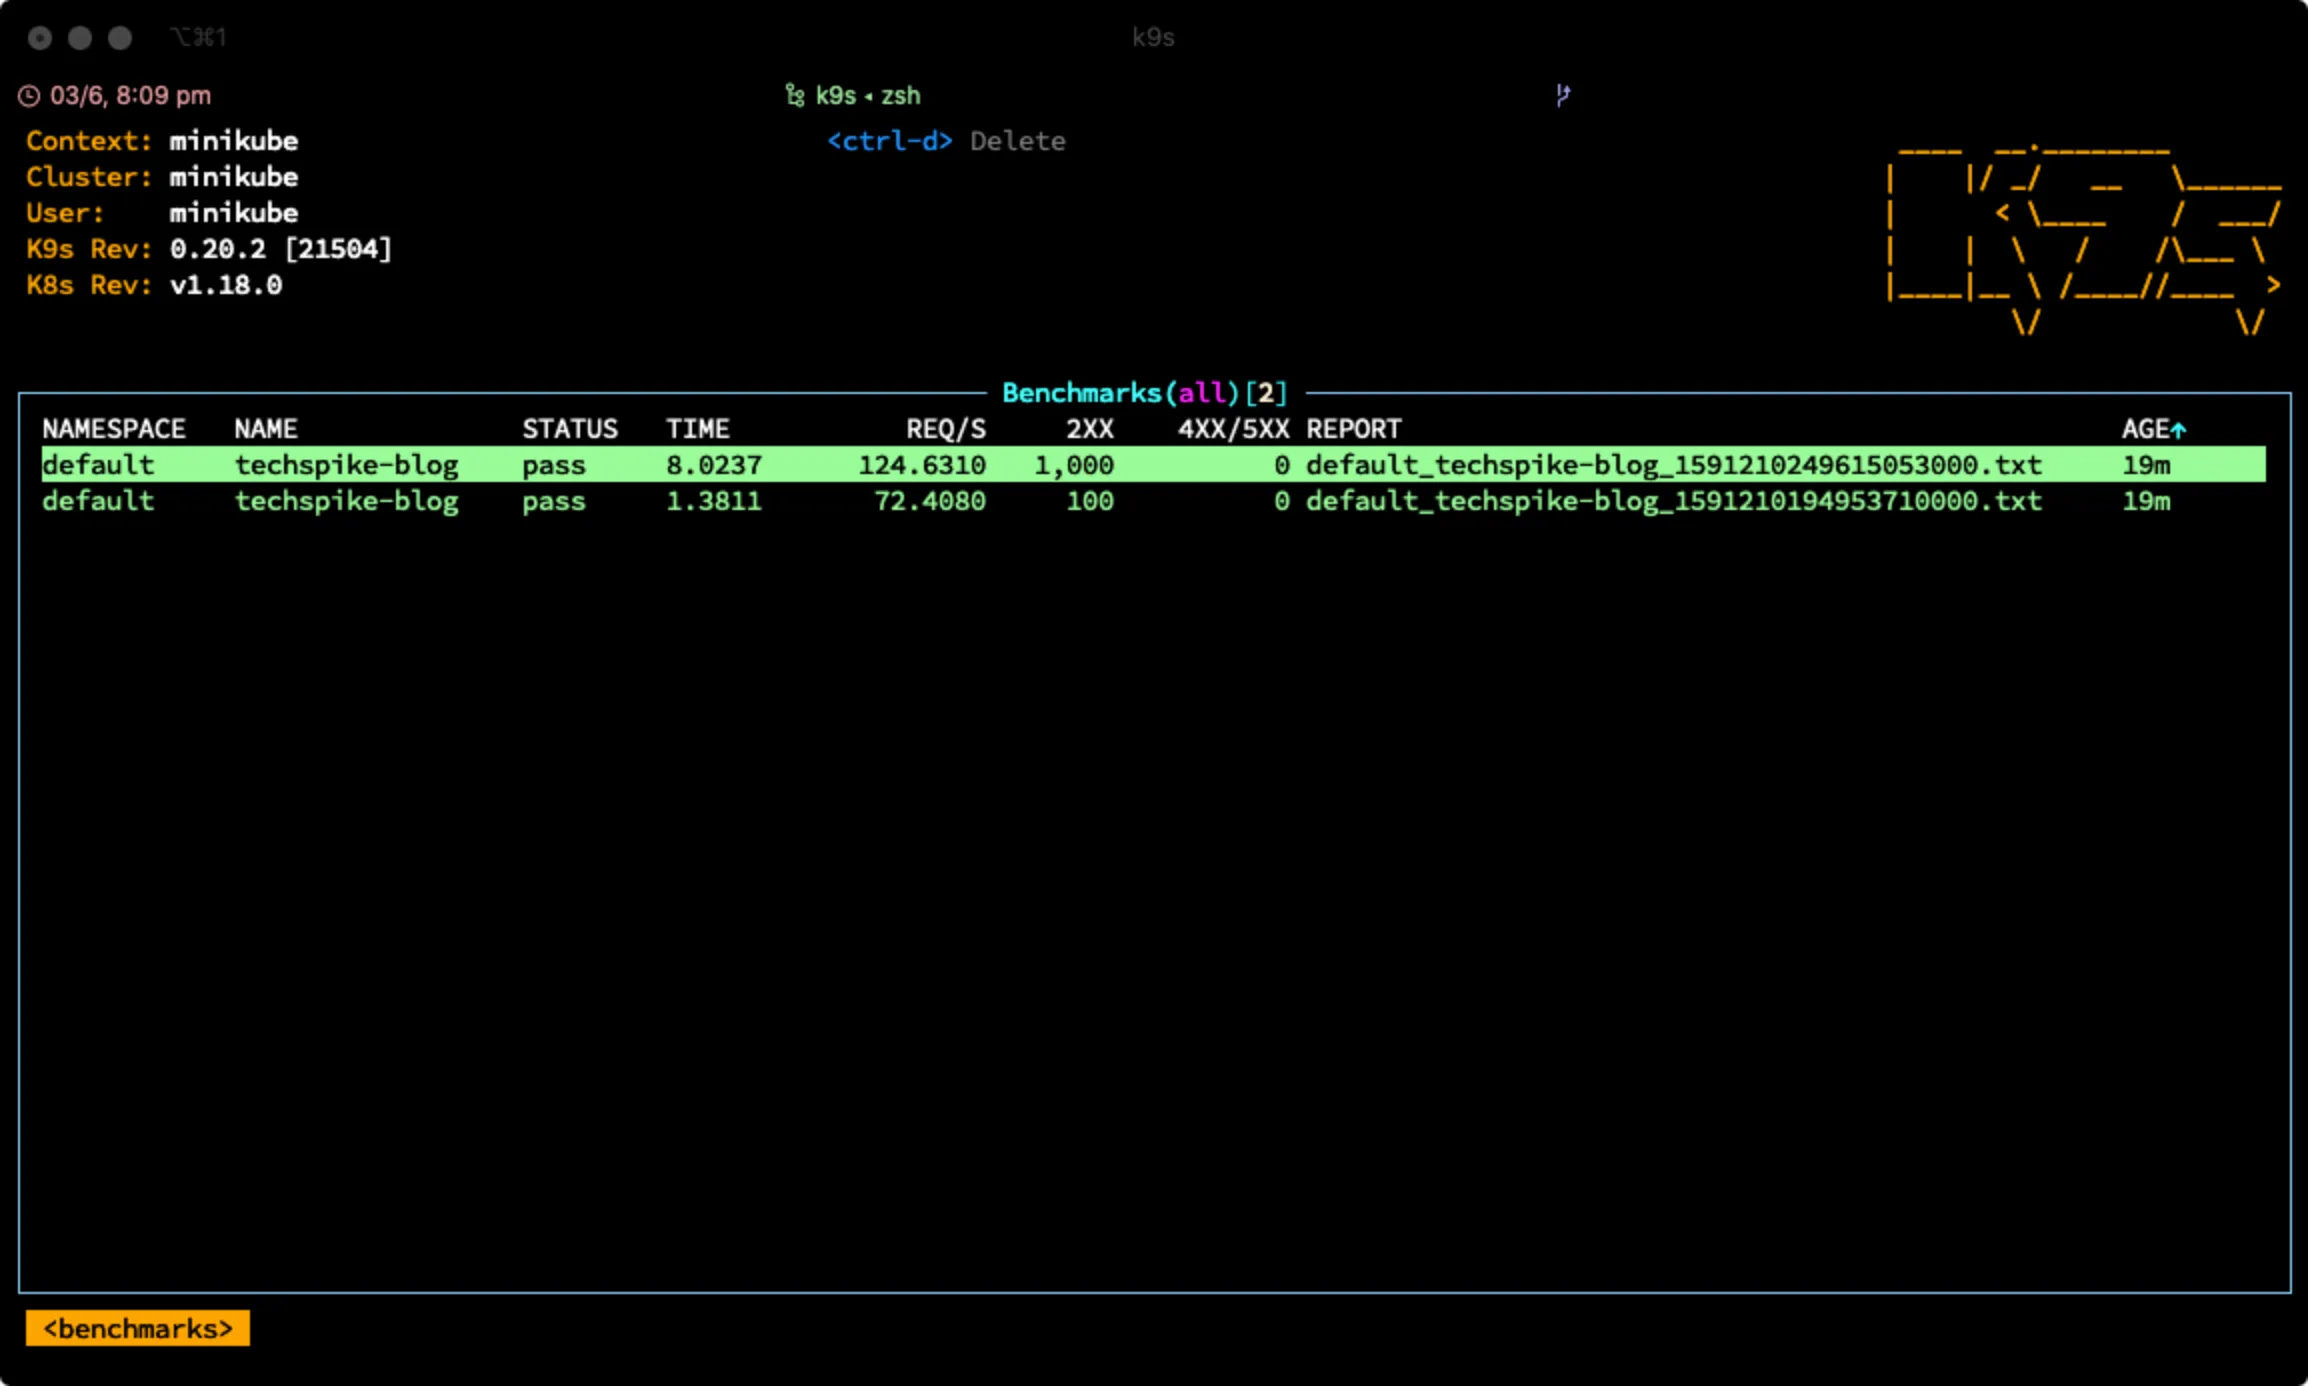
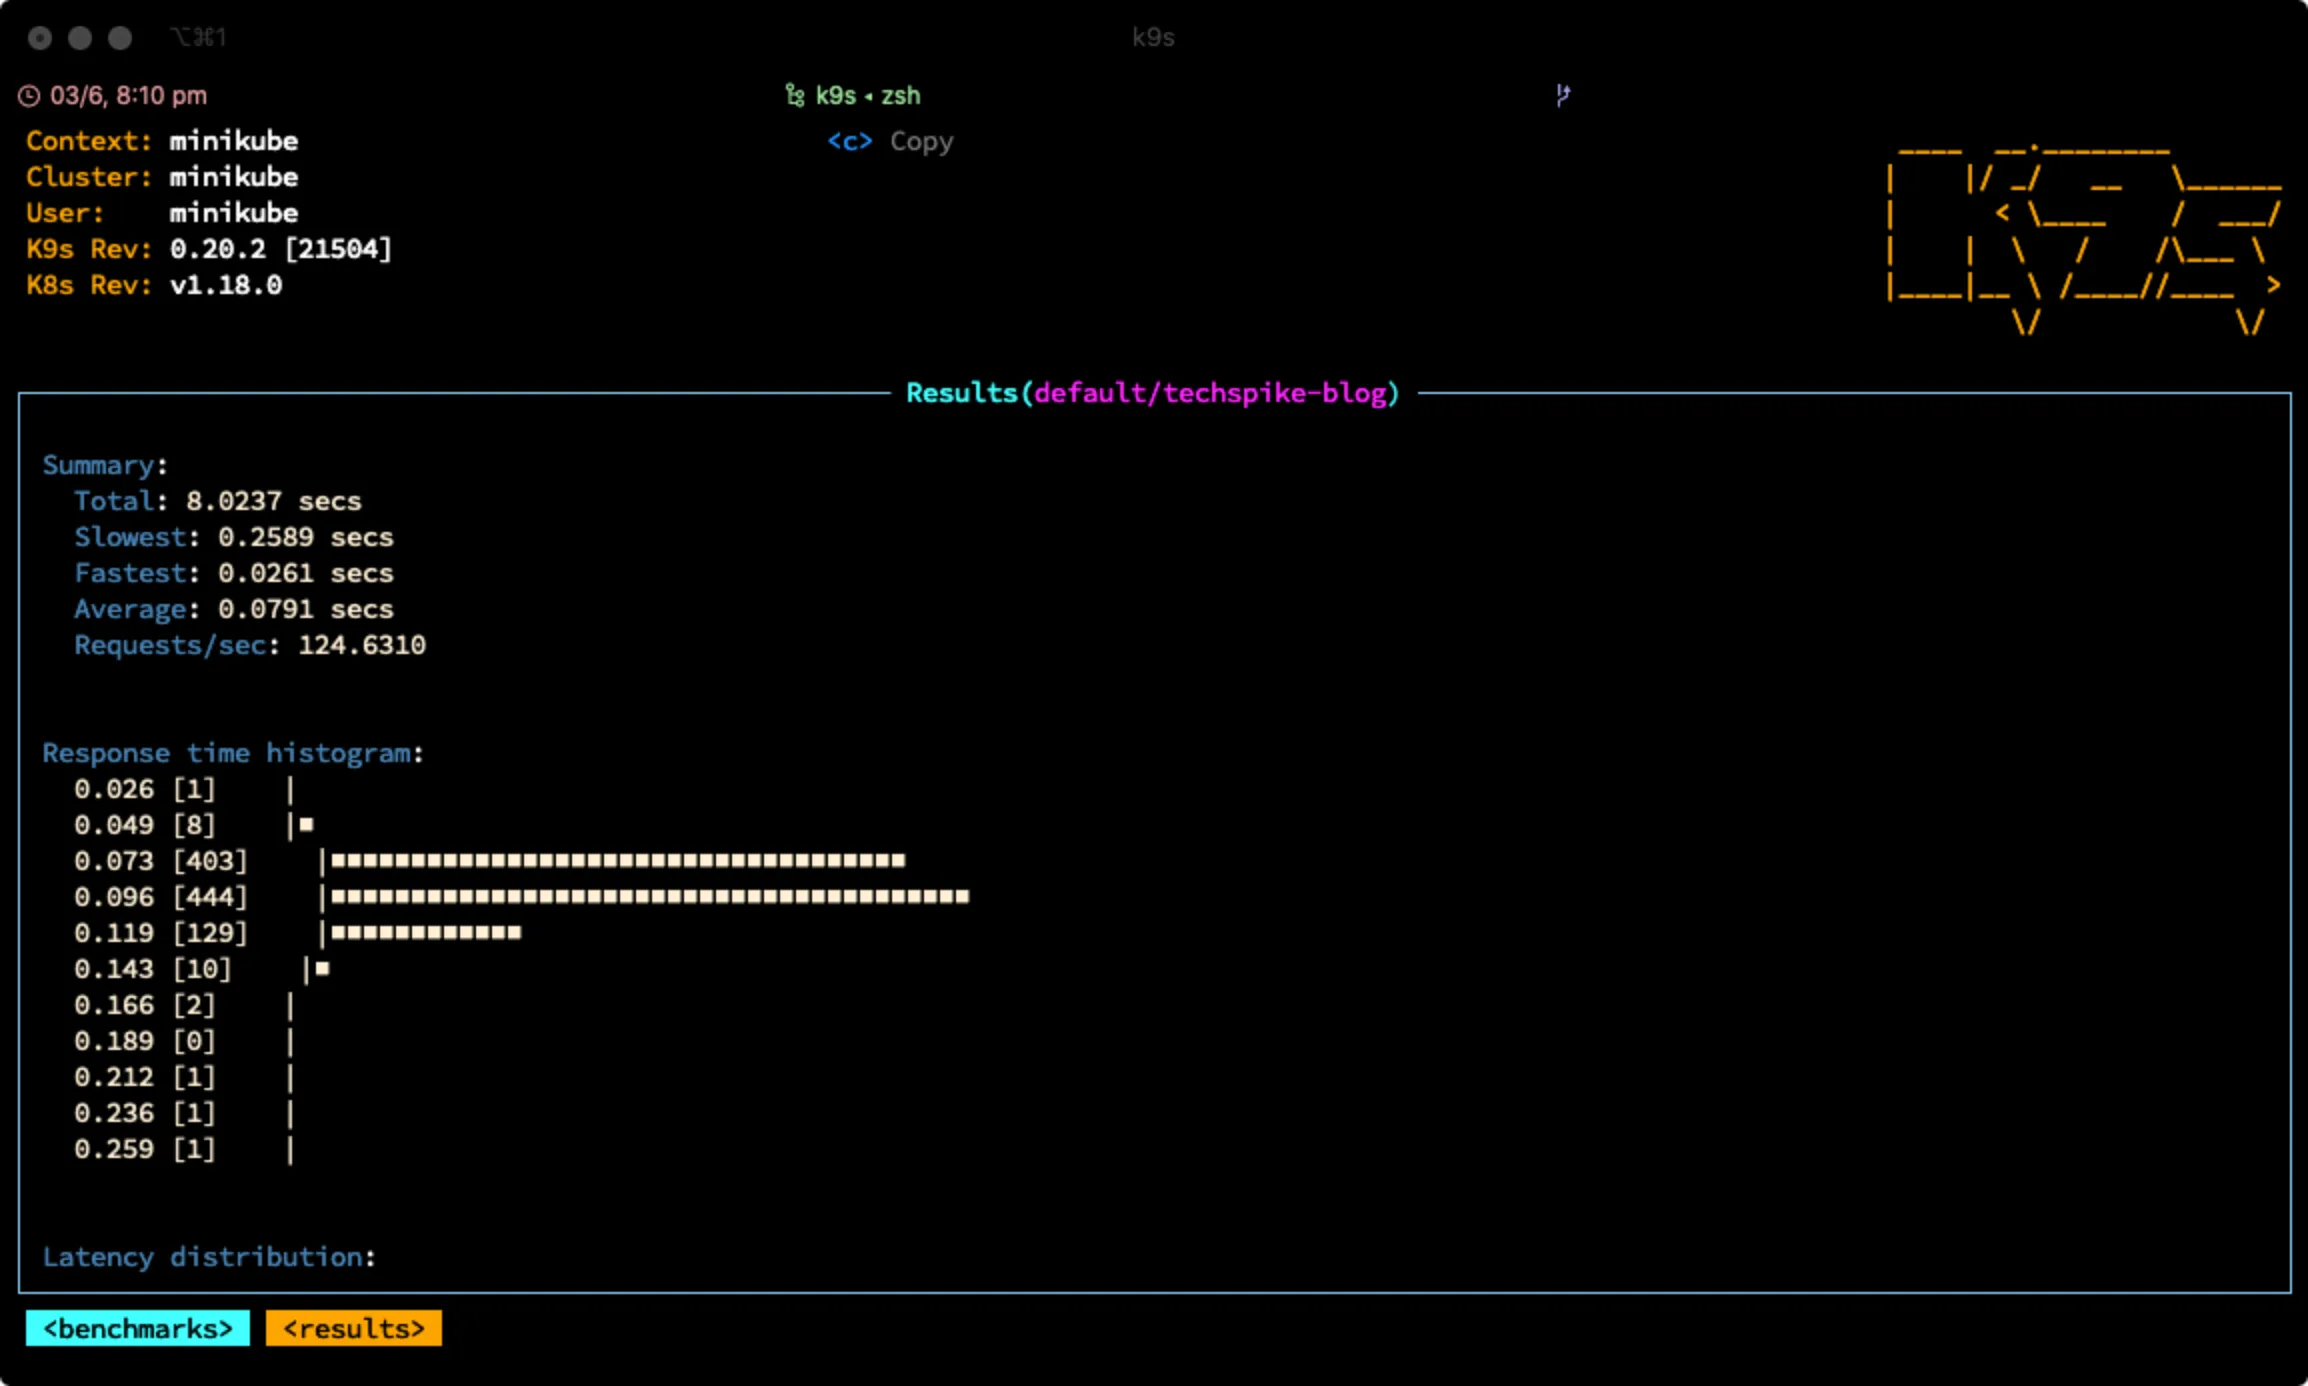
Benchmarking
K9s provides the ability to benchmark services running in your cluster directly from within the tool. You provide K9s with a benchmark configuration file which describes how you’d like your service to be benchmarked. An example configuration can be found here.
Once set up, you can benchmark your service directly in the tool by setting up a
port-forward and then executing the benchmark command <ctrl-l>. The benchmark tool uses
Hey behind the scenes — another great CLI tool you can use
standalone if you want to send some load to a service and monitor metrics such as response
time.
Conclusion
As you can see, K9s offers a vast array of features, some of which I’ve highlighted above. For a full list, please refer to the project documentation. What I love about K9s is that it’s a native CLI tool which interacts with Kubernetes in a completely unobtrusive way. There’s no need to install anything in the cluster itself, and there’s no browser-based UI to click through or to expose correctly in order to access.
You immediately have a lot of information and insight into your cluster, literally at your fingertips. It has a growing community behind it and an active development cycle, with new features added at regular intervals.
Definitely one to watch — and to keep in your DevOps toolbox.